Those who work in agriculture should never forget one of the most efficient formulas that nature has selected in the evolutionary process: that of chlorophyll photosynthesis. Briefly translated:
water + carbon dioxide + light = glucose + oxygen
If we were to combine two simple ingredients like water and CO2, we would not obtain the same result, as solar radiation is required as a catalyst for the formula and a plant as a “factory” for the production of sugar and oxygen. Thanks to this process, the plant is among the few living organisms capable of producing more energy (trapped as glucose) than is needed just to vegetate. From this derives the ability to produce more or fewer fruits. Keeping the photosynthesis formula clearly in mind, it is deduced that a plant placed in a condition to optimize the photosynthetic process has a higher-than-average production potential. This is therefore the main objective of modern intensive cultivation techniques, aimed at maximizing production within the quality limits determined by the buyer.
Tomato Crop Registration
However, it would be an oversimplification to think that to produce more, one simply needs to increase the doses of water, and thus the irrigation volumes. Here is where the subtleties begin. The tomato plant in a greenhouse—to take a specific case—needs water for various physiological processes, and it absorbs it based on root pressure, osmotic differential, and evapotranspirative speed through the stomata present on the leaves. Consequently, the plant’s actual irrigation requirement varies as different factors acting in the surrounding environment change, including:
- Humidity of the root zone
- Start, end time, and frequency of irrigations
- Salinity of the circulating nutrient solution
- Number and size of leaves
- Plant spacing (potentially variable)
- Relative humidity and temperature, i.e., humidity deficit
- Instantaneous light intensity incident on the leaves (with or without shading screens)
- Type, position, and opening percentage of vents
- Windiness
- Destratification and/or humidification devices
How can one simply and immediately control these variables and the subsequent reactions of the plant to the various and sometimes random “treatments” it undergoes in the greenhouse?
For many years, primarily promoted by Dutch consultants worldwide, a system for recording crop data known as “Crop Registration” has become established. Almost every company, professional, or body that considers it an effective model has created a more or less personalized version, but all versions are based on two aspects:
- Weekly measurement of the main plant growth parameters
- Recording of the main irrigation, climate, and production variables
When anomalies in plant growth are detected, it is possible to trace the originating cause by analyzing the recorded climatic and irrigation data. Conversely, by keeping the climatic and irrigation parameters within certain limits, one can expect precise results in terms of growth and production. Crop Registration (CR), therefore, is an important tool for combining the complexity of the modern market’s quality-quantity requirements with the inviolable laws of nature (photosynthesis) that remain the basis of agriculture.
Crop Registration measures the plant’s health status to help us make the most appropriate cultural decisions immediately and reduce margins of error. It also serves to research and find the causes of a cultural problem, leaving a visible record of an error not to be repeated. Conversely, in the case of optimal crop performance, it can serve to make the long and intense months of cultivation traceable and repeatable every season, constituting a sort of “good cultivator’s manual” easily consultable by anyone interested (consultant, partner, new hire, bank, accountant, etc.).
If you work in a team with other companies or have multiple production sites that are physically separated and managed differently, CR allows for immediate comparisons based on the same parameters measured at different sites. It therefore becomes a tool for training and communication, crucial for accelerating the implementation of winning cultural strategies.
Finally, CR constitutes a fundamental historical archive of previous crops, already organized chronologically and always comparable with future production cycles at the same times.
The translation of plant growth parameters into numerical values protects against disparate interpretations by different observers. For example, the concept of a “lush” plant is replaced by values such as the number and size of leaves; or the “production estimate” for the following weeks is replaced by values such as fruit set, harvest speed, and average fruit weight, which, combined, provide a precise idea of the expected production for the next seven days. The same concept applies to irrigation and climate: “abundant irrigation” becomes “300 ml per dripper,” “humid greenhouse” becomes “85% relative humidity”; in short, all numerical values that leave no room for free interpretation or momentary feelings.
The phase following data collection is the correct interpretation of the data. In order not to constitute simply a useless additional workload, measurements must be correctly interpreted to convert them into usable “information” that contributes to daily plant management decisions. The final objective of this phase is the prevention of cultural problems, since morphological changes in the plant or irrigations/climate outside the strategy constitute the prelude to an anomaly. Noticing it in time allows for correcting the cause, thus avoiding the problem. The result of this operation is intuitive: improvement in production in quantitative and qualitative terms.
ACC Crop Registration
The AgeonCropConsulting Crop Registration version is very simple thanks to the MYAgeon platform. It is sufficient to fill in the required fields weekly in the “Crop Registration” session. The collected data are then processed together with those from previous weeks and displayed in graphs and tables. If you have the G.IoT.T.To® IoT system, 70% of the required data is filled in automatically, thus reducing the time needed for its detection and compilation.
After setting the general cycle data (information on the production site, variety, greenhouse size, and substrate format), AgeonCropConsulting CR is structured into 6 sessions or tables for data collection:
| Section | Description | Compilation |
| External Climate | Temperature, humidity, radiation, windiness, etc. | Weekly |
| Internal Climate | Temperature, humidity, heating, CO2, energy consumption, etc. | Weekly |
| Water | Irrigation times, volumes, number of cycles, drainage, substrate EC and pH, substrate humidity, etc. | Weekly |
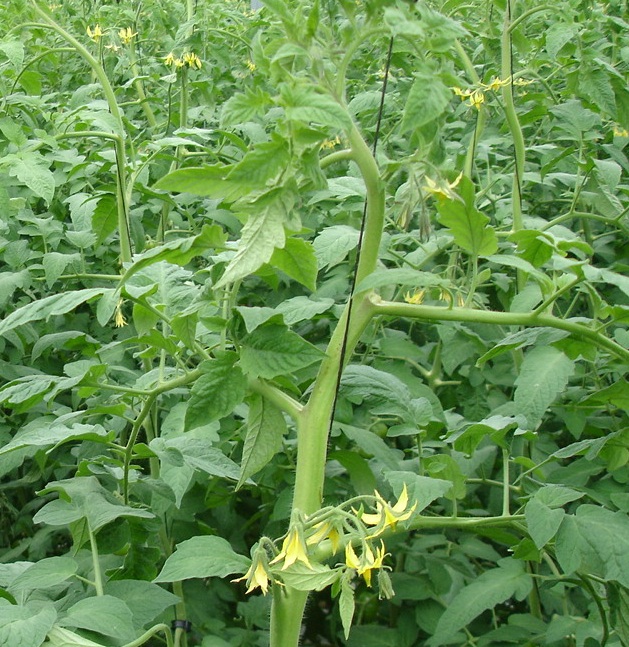
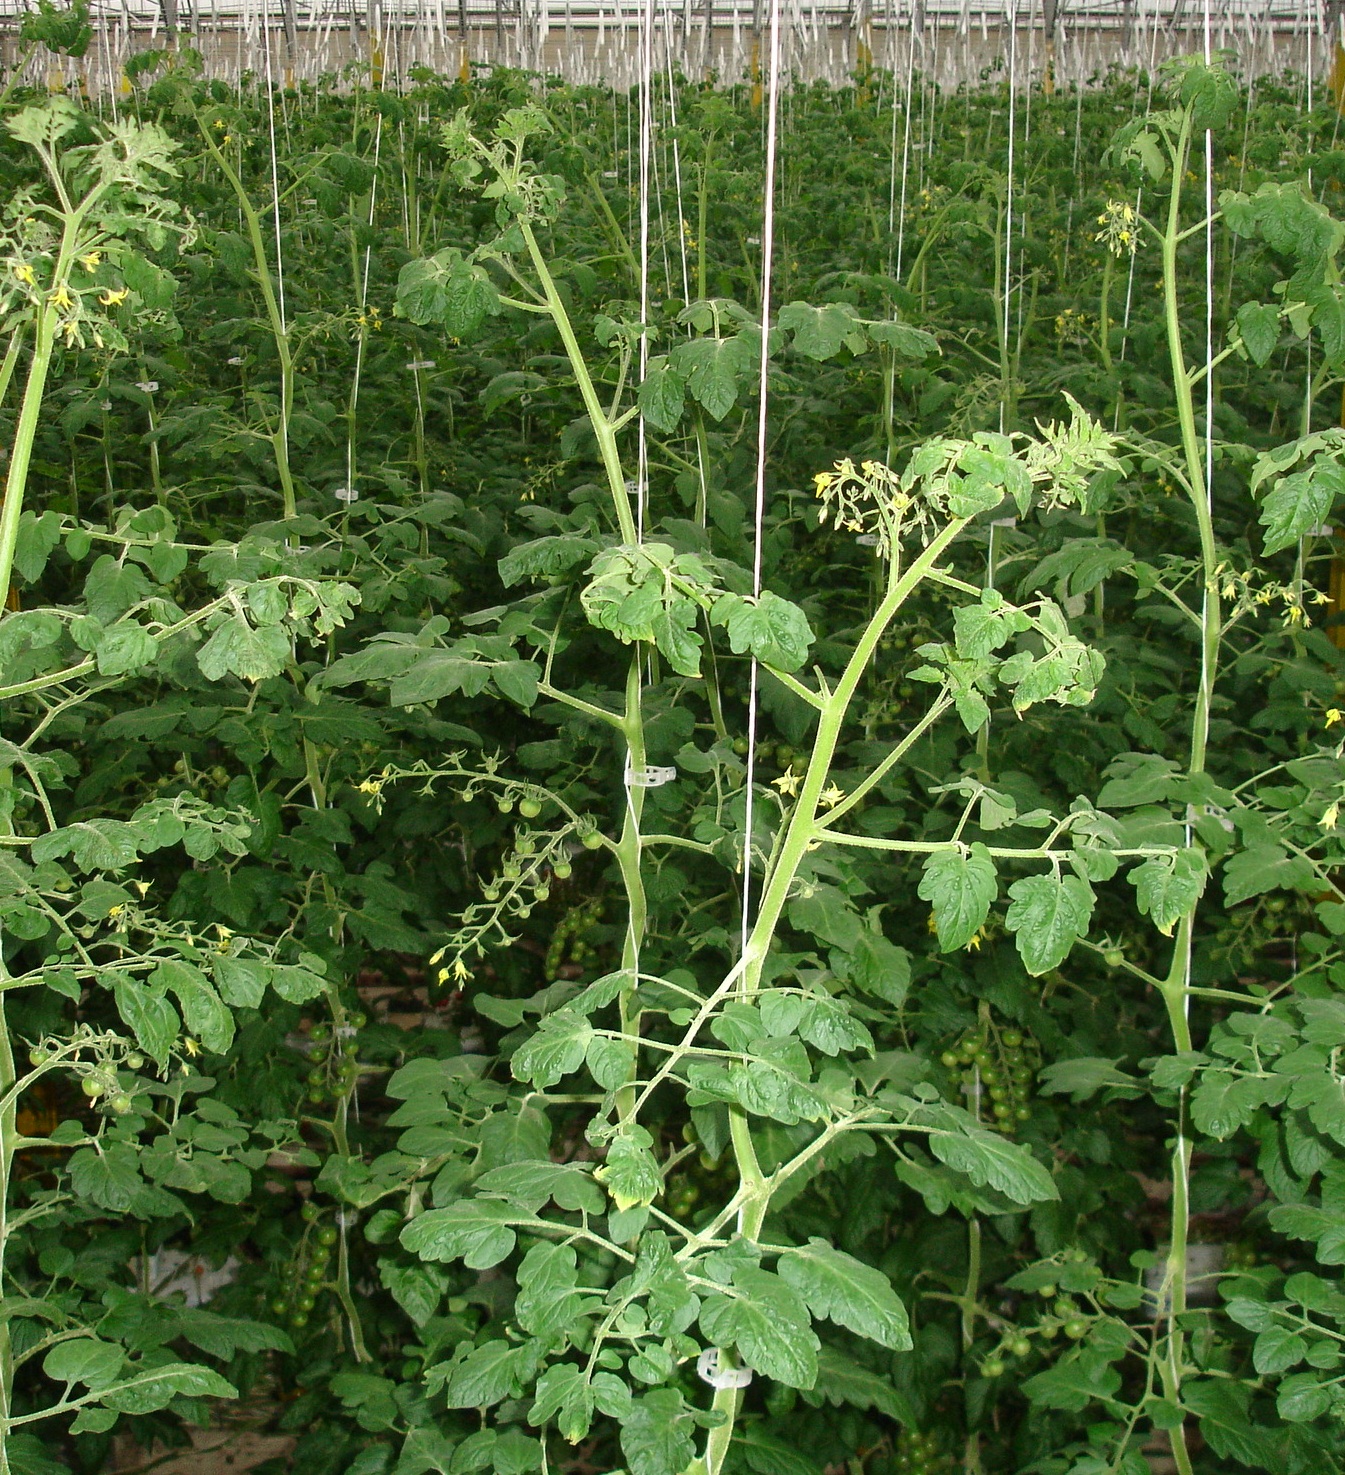
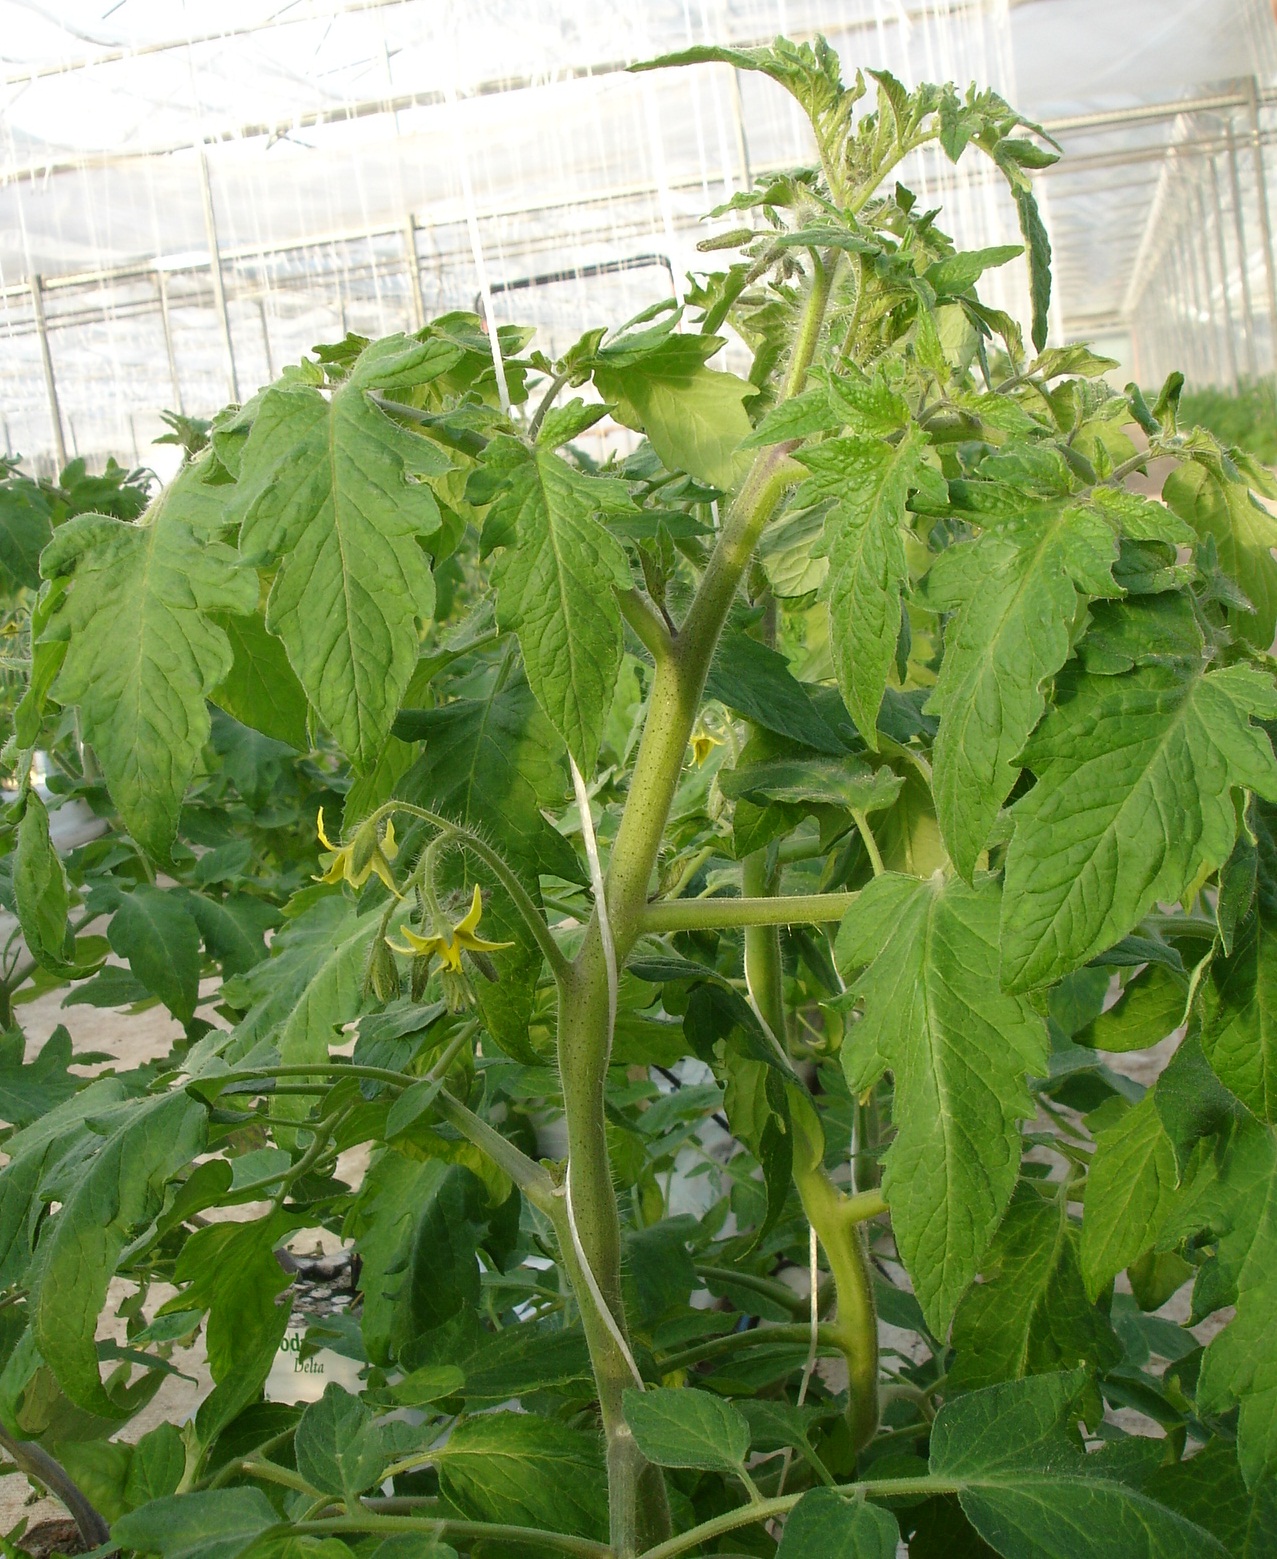
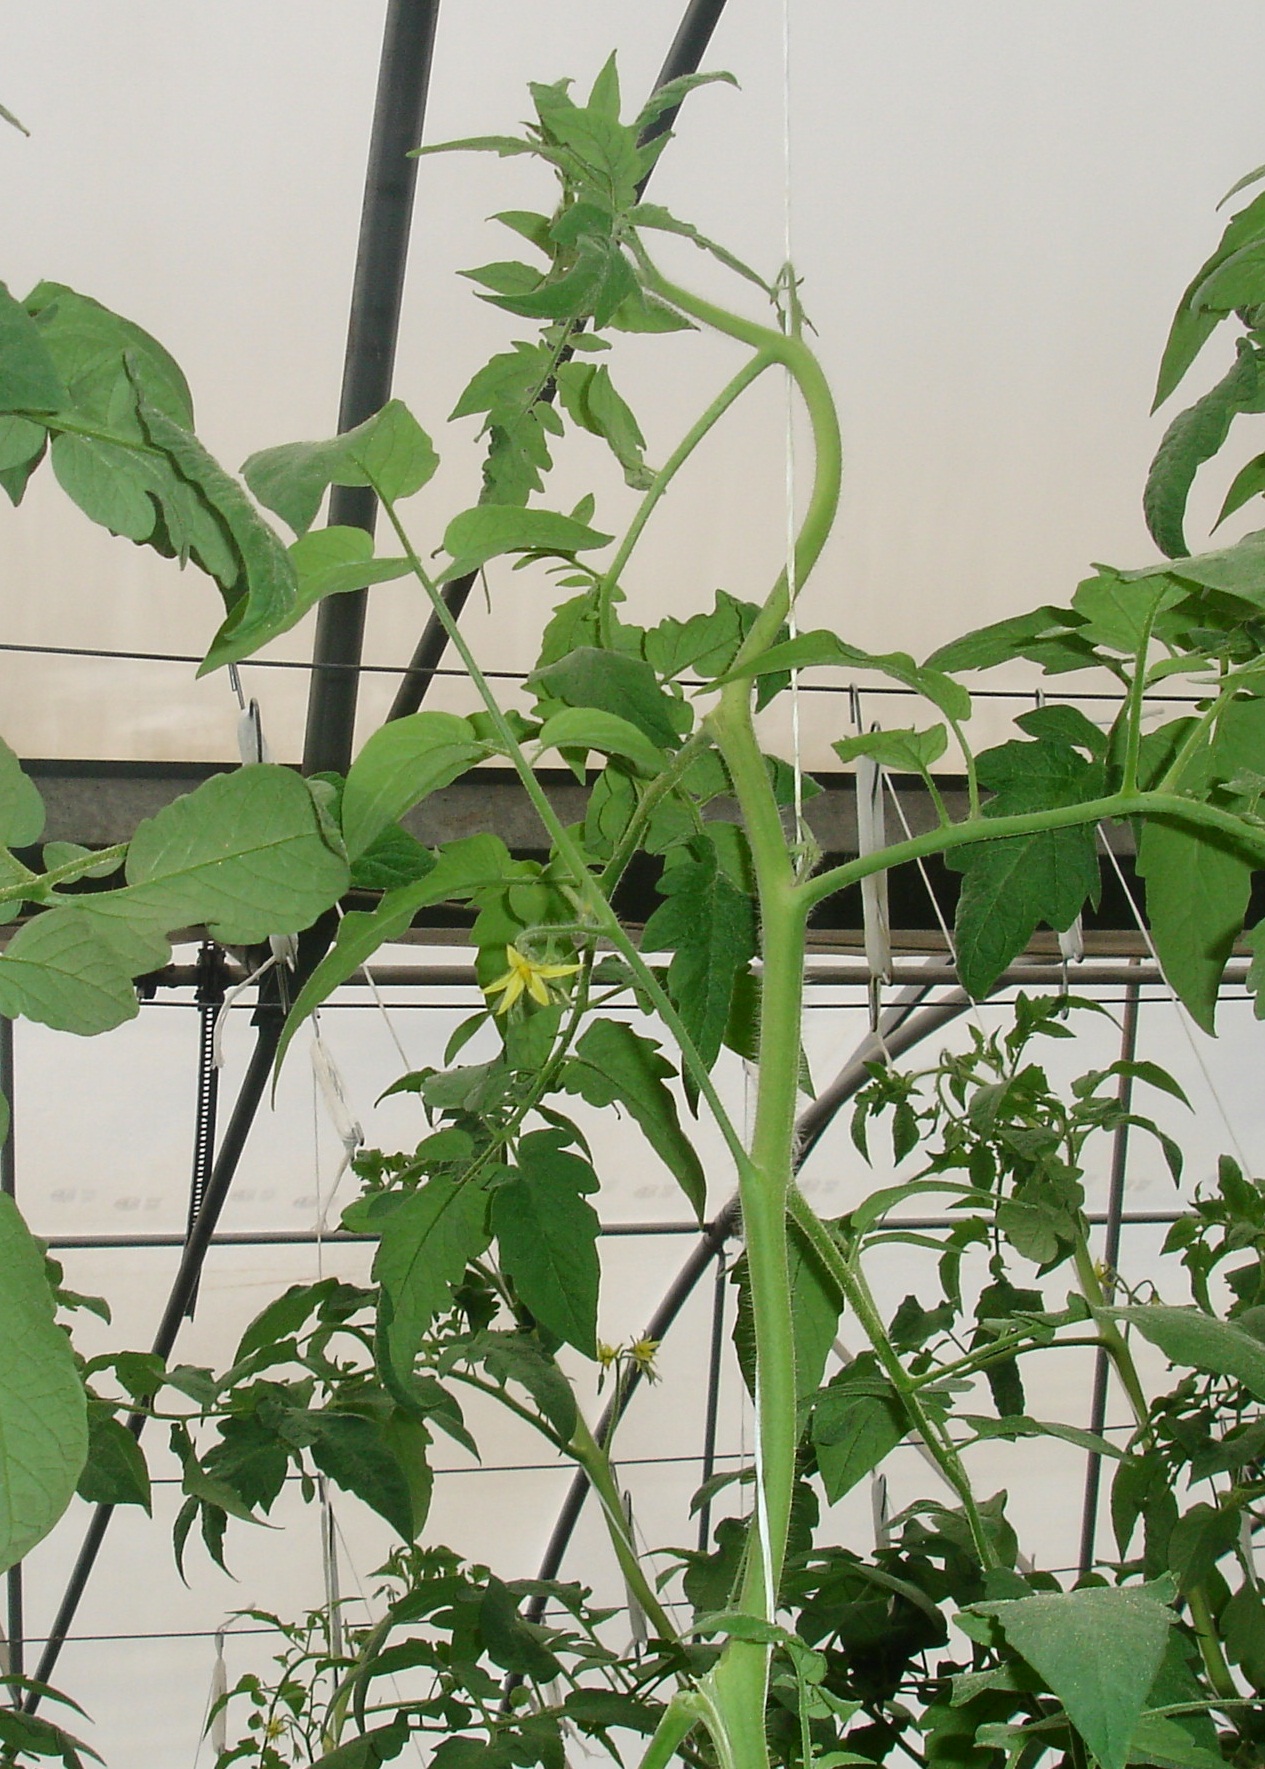
| Plant Measurements | Weekly growth, flowering distance (Fig. 1), stem diameter (Fig. 2), leaf length (Fig. 3), number of leaves, flower cluster-set-harvest (Fig. 4), fruit set. | Weekly |
| Harvest | Total harvested quantity, total discard quantity, average fruit weight. | Daily, whenever harvesting occurs |
| Summary | Summarizes all the above values expressed as weekly averages or cumulative weekly data. Updates automatically. | Automatic |
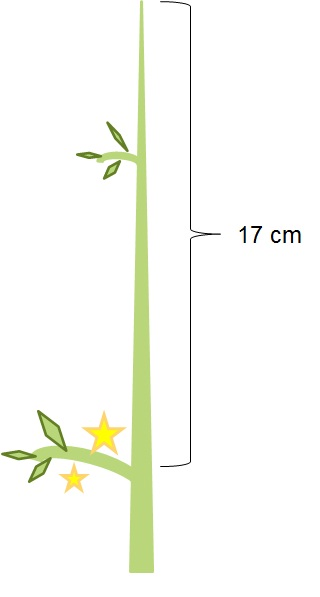
Fig. 1: Flowering Distance. Distance between the vegetative apex of the stem and the nearest floral cluster with at least 1 open flower.
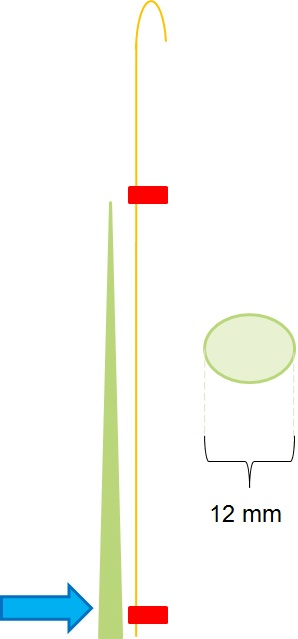
Fig. 2: Stem Diameter. Width of the largest cross-section of the stem, measured at the growth point of the previous week.
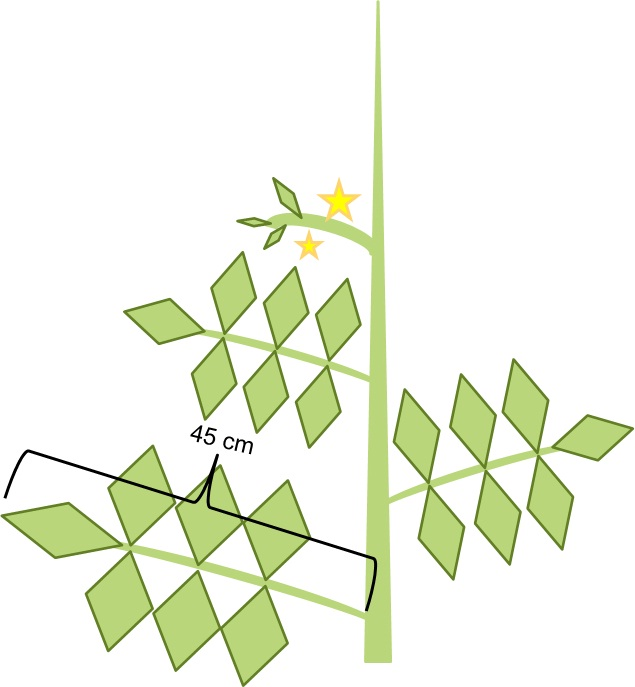
Fig. 3: Leaf Length. Distance between the stem and the distal portion of the third leaf below the last flowering cluster.
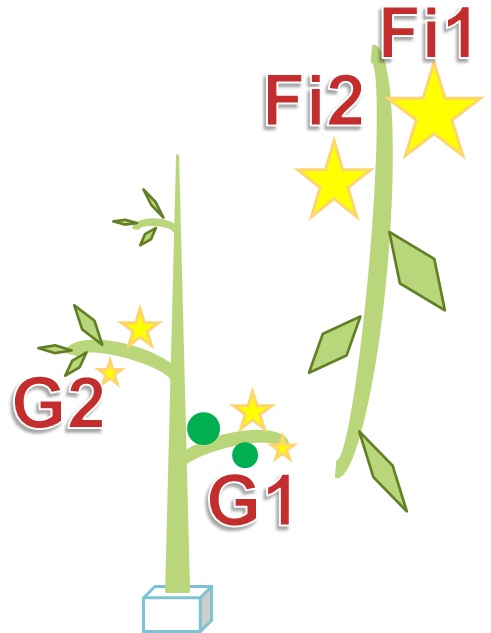
Fig. 4: Floral Cluster (or Flower Cluster). Each cluster is uniquely identified with a number increasing from bottom to top. Each flower is uniquely identified with a number increasing per single cluster, from the proximal flower to the distal flower.
Plant measurements must be taken on a sample number of plants adequate for the cultivated surface. Normally, 12 plants per hectare are identified, chosen according to the following rules:
- In homogeneous sectors regarding variety, irrigation, climate, greenhouse
- Equally distributed between North and South compartments
- Equally distributed between East and West exposure
- Central aisles
- Central rows
- On different substrate slabs
Vigour and Balance
Among the many parameters considered and measured in the CR, there are two that constitute the “heart” of the model:
- Stem Diameter (Fig. 2)
- Flowering Distance or Head Distance (Fig. 1)
Vigour
Stem diameter measures the so-called plant “vigour”: this measurement is an indirect way of quantifying the energy accumulated by the plant in that portion of the stem thanks to photosynthesis. Greater photosynthetic efficiency leads to a strengthening of the stem (“high vigour” or “strong stem”), a sign of high photosynthate availability, hence energy readily available for growth and production of quality clusters. Conversely, lower photosynthetic efficiency results in a thinning of the stem (“low vigour” or “weak stem”). For example, a slender stem (7-8 mm) easily induces the overlying flower cluster to differentiate a reduced number of flowers on the rachis; or it does not supply the cluster with sufficient energy during the fruit setting phase, leading to partial abortion or the differentiation of small, deformed fruits with few seeds (hollow fruit) in which seeds and placenta detach from the endocarp. On the other hand, excessive vigour represents another obstacle to quality production, as it leads to the differentiation of unusually large clusters with ribbed and “boxed” fruits. Furthermore, an excess of vigour occurring in a specific period of the cycle will cost in terms of future weakening of the stem.
Other elements alter the stem diameter. An excessive fruit load costs the plant a lot of energy intended for berry growth, colour change (véraison), and ripening. Especially in long cropping cycles, this poses a threat to the quality of clusters that set high up while the first ones below are ripening. Therefore, an initial excessive fruit load gives the illusion of equally good production later in the season, but the plant arrives weakened during critical periods (e.g., summer heat or winter darkness) and cannot guarantee sufficient production and good quality in the second half of the cycle.
By working with CR, all these aspects are predictable and avoidable. Respecting the optimal values of the various CR parameters ensures more stable production over time and of superior quality.
Balance
Flowering/head distance measures the so-called plant “balance”: depending on whether the youngest cluster flowers higher or lower on the stem, the plant is undergoing a “generative” phase (growth pushed towards fruit production) or a “vegetative” phase (growth pushed towards the production of leaves and green parts). In this case too, it is advisable to avoid excesses in increasing or decreasing the flowering distance, and for each tomato type or variety, there are optimal values to pursue to have a plant that is “balanced” between leaf and fruit production.
A crop that is too generative tends to weaken over time because it is excessively loaded with fruit. A plant that is too vegetative, however, produces clusters with very long internodes, with an easy risk of rachis kinking and greater sensitivity to Botrytis cinerea attacks on the stem.
CR also helps in terms of balance to promptly recognize the moments of generative or vegetative shift, allowing targeted actions to be taken to provide impulses of the opposite sign to avoid excesses.
Fig. 5: Graphs for the evaluation of Vigour (a) (stem diameter) and Balance (b) (head distance).
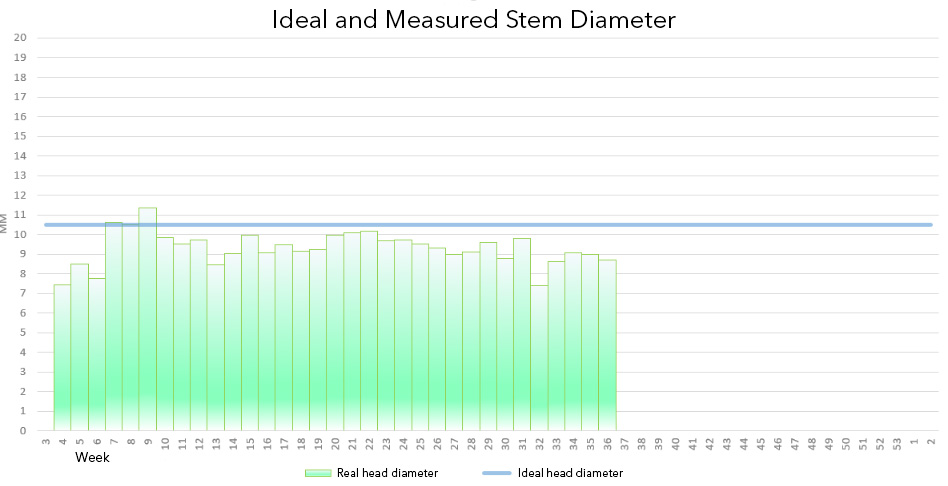
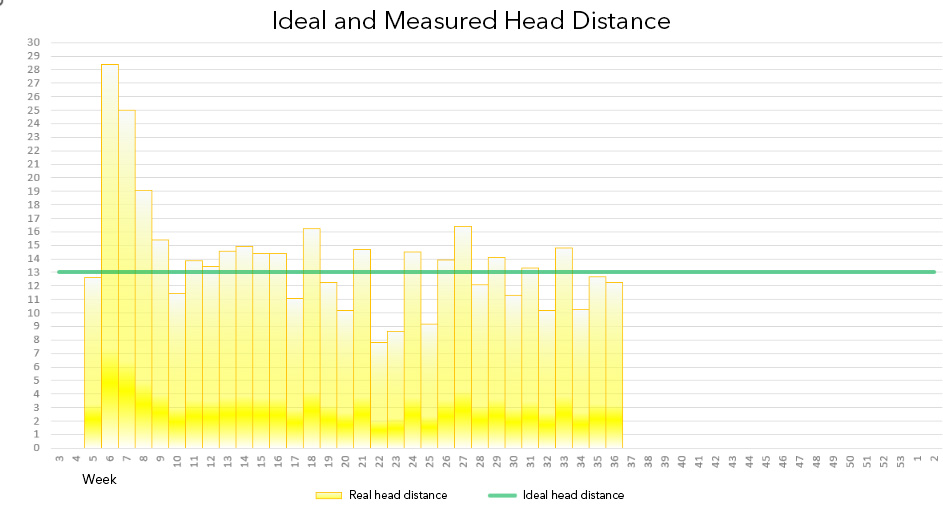
Vigour and Balance expressed graphically appear as indicated in Fig. 5. The intersection point of the abscissa (central horizontal line) and ordinate (central vertical line) represents the objective to pursue every week.
On the abscissa, Balance is measured, with the center (optimal value) usually oscillating between 13 and 18 cm depending on the tomato variety cultivated. Measurements falling in the two left quadrants are generative, while those on the right are vegetative.
On the ordinate, Vigour is measured, with the center (optimal value) usually oscillating between 10 and 12 mm depending on the tomato variety and the rootstock. Measurements falling in the two upper quadrants are “strong/vigorous,” while those below are “weak.”
The numerical value in each circle indicates the week number to which the center of the dot refers, having as coordinates precisely the stem diameter and flowering distance.
There is a list of actions related to climate management, irrigation, plant work, and nutrition that, depending on the position of the dot, are adopted to have generative or vegetative corrective effects, to strengthen or thin the stem. Therefore, with the help of CR, it becomes relatively simple to “understand” the tomato plant and—always keeping in mind the photosynthesis formula initially recalled—act in a way that keeps the plant vigorous, strong, and balanced.